Attribution quality
Which users appear across paid, organic and field marketing, and how should that overlap be interpreted?

Awareness · Digital & Paid Marketing
I analyzed overlap between paid acquisition, organic traffic and field marketing to understand each channel’s contribution. I then examined first-order timing, repeat purchase and acquisition costs to compare budget options and identify where performance was constrained.
Which users appear across paid, organic and field marketing, and how should that overlap be interpreted?
How quickly do users place their first order, and how often do they order again?
Is performance limited by exposure costs, downloads, first-order conversion or channel overlap?
What changes when budget increases at a fixed acquisition cost, or cost falls at a fixed budget?
I compared registration source, first-order source and the time between the two events. This helped distinguish paid contribution from overlap with organic and field acquisition, rather than treating every shared user as entirely attributable to one channel.
I also compared repeat ordering after the first order. In the global cohort shown below, the paid/organic overlap group had a 56% seven-day reorder rate, compared with 34% for the organic-only group. This describes cohort behavior, rather than proving an incremental paid effect.
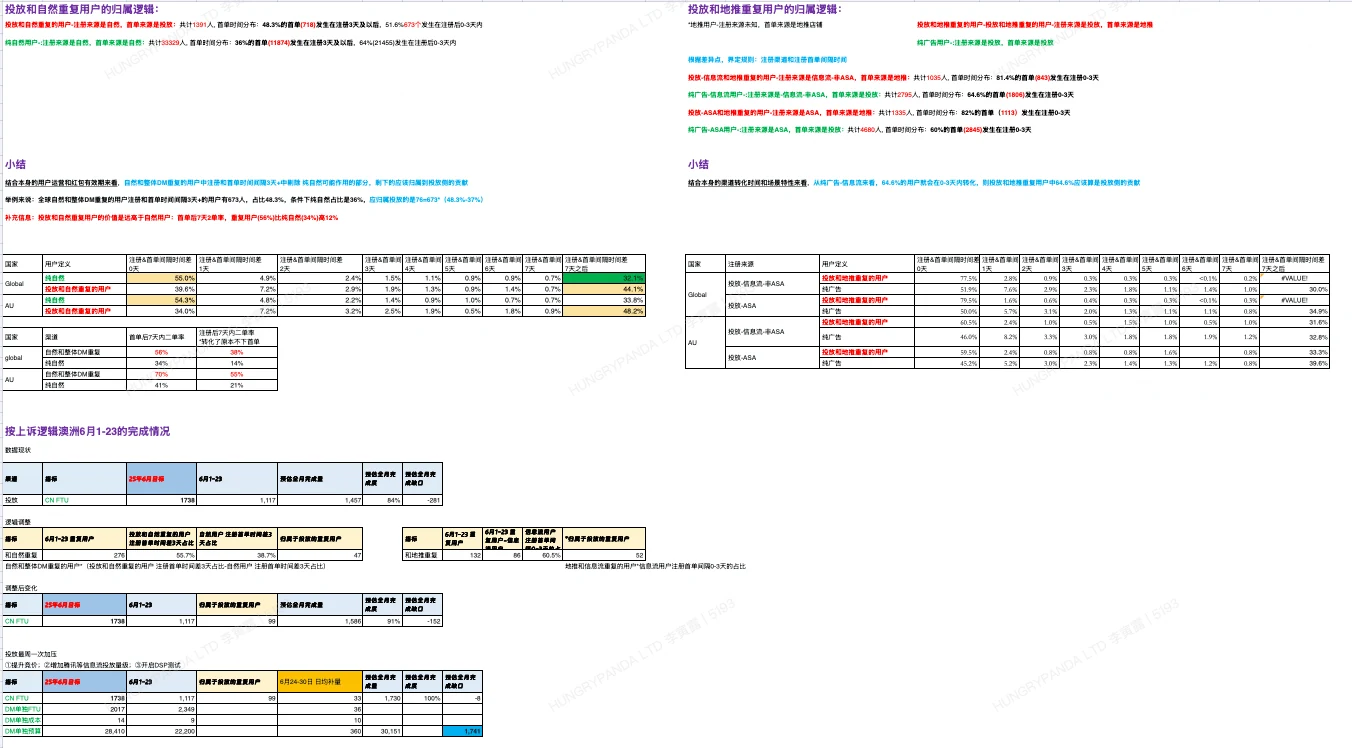
Attribution rules, timing and reorder analysis · Click to enlarge
I compared ASA brand and non-brand terms, Google, Weibo, Tencent and other channels across months, separating organic overlap from overlap with field marketing. This made it easier to identify where reported acquisition needed closer review.
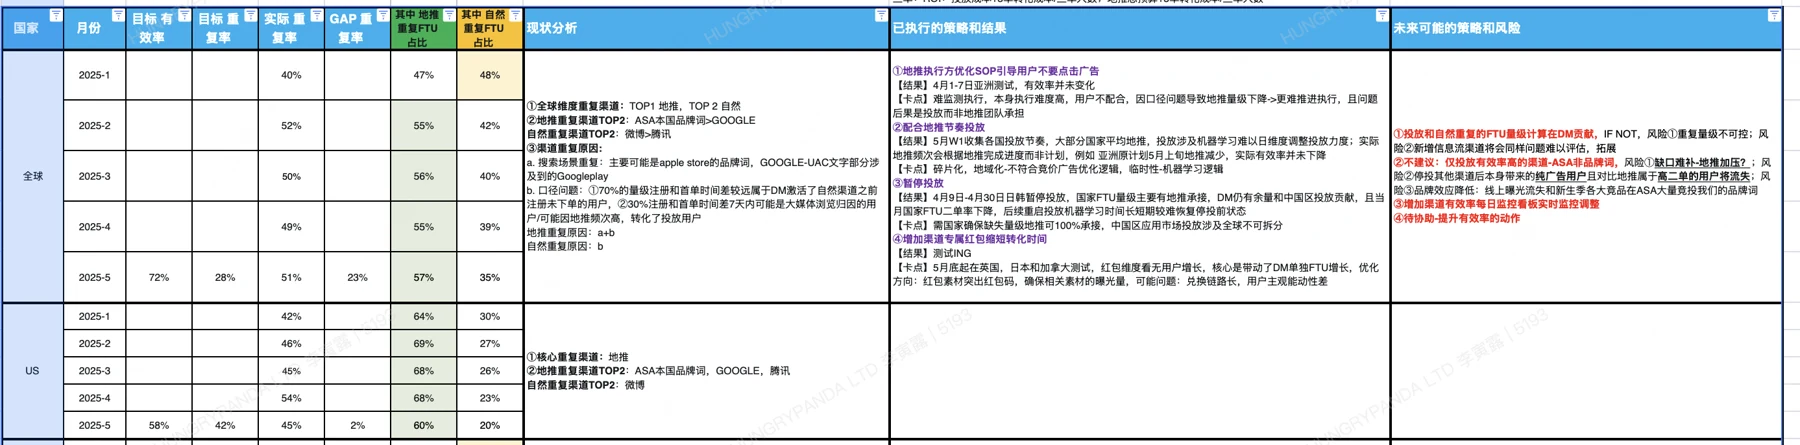
Monthly overlap diagnosis and strategy review · Click to enlarge
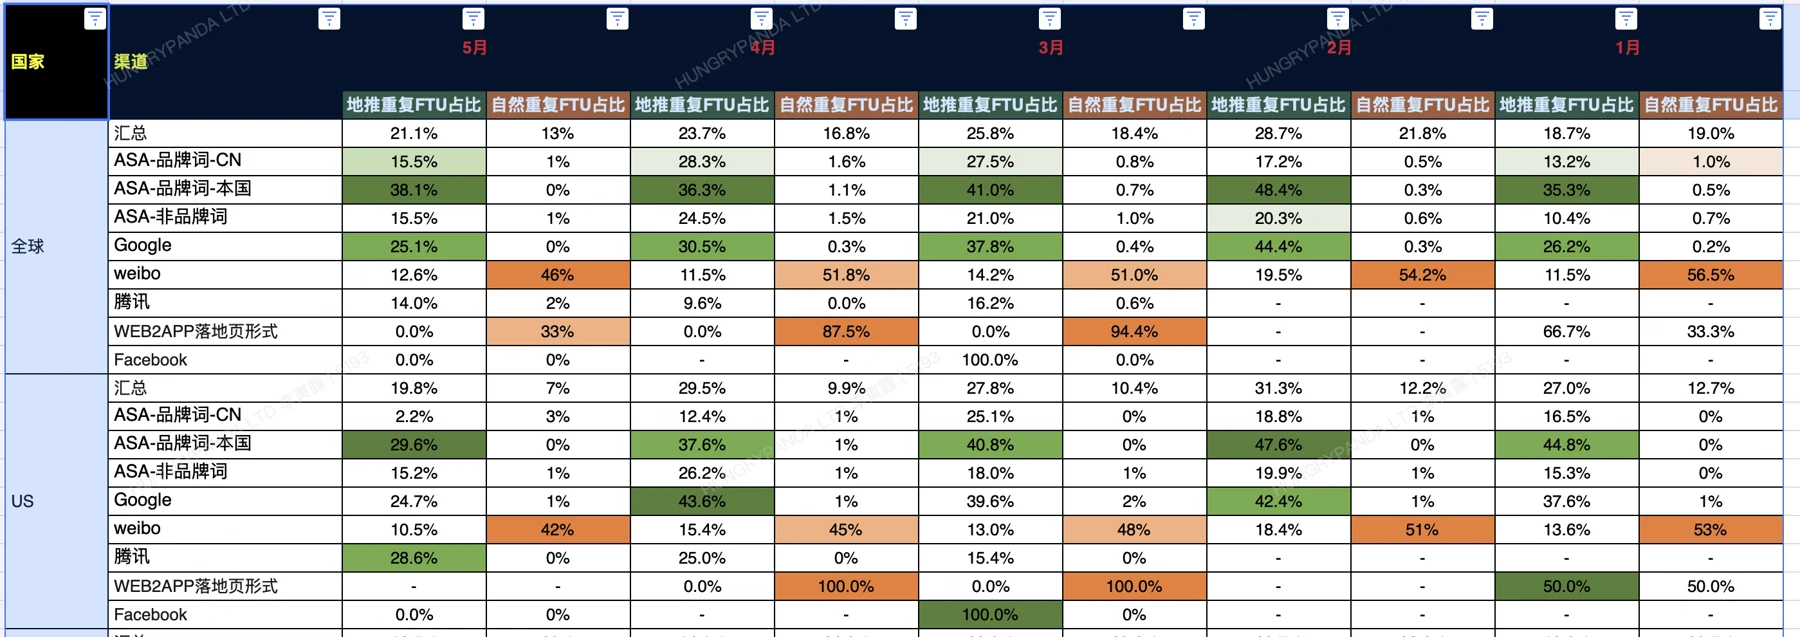
Channel overlap breakdown from January to May · Click to enlarge
I broke acquisition down into exposure, downloads and first orders, then compared two scenarios against the same deduplicated acquisition target: more budget at a fixed cost ceiling, or lower acquisition cost within the existing budget.
| U.S. scenario | Scenario 1 | Scenario 2 |
|---|---|---|
| Planned standalone paid FTUs | 3,237 | 3,237 |
| Modeled standalone acquisition cost | 17 | 15 |
| Modeled budget | 54,383 | 47,916 |
Figures above are planning scenarios from the analysis, not achieved campaign results. FTU refers to users completing their first order; deduplication follows the internal analysis definitions.
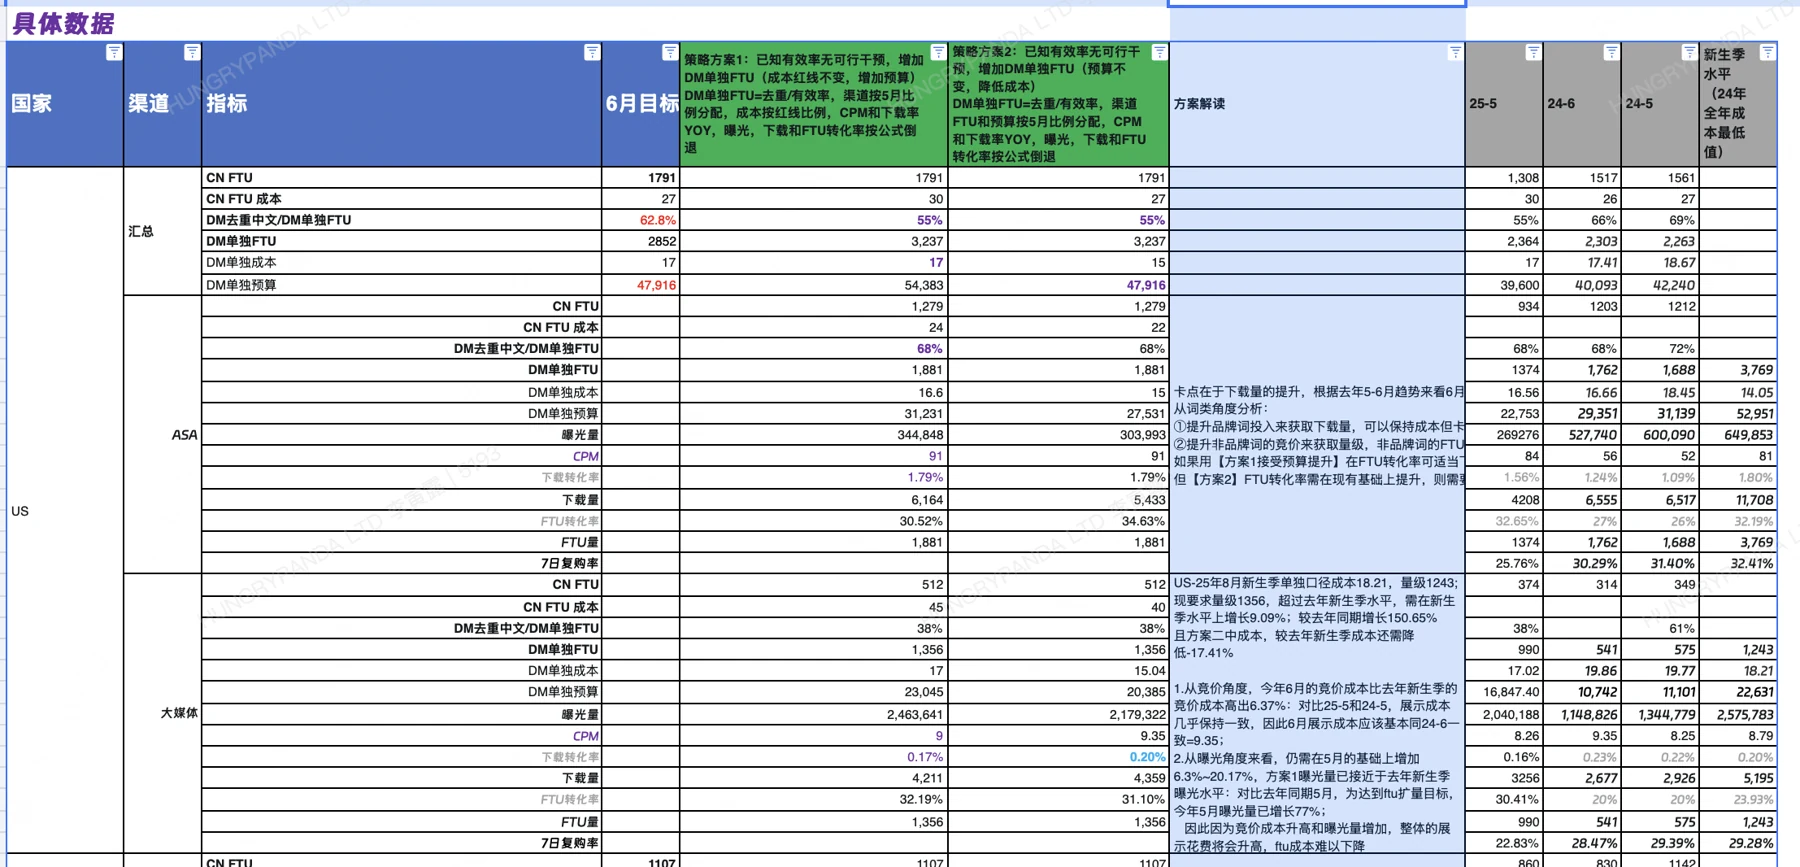
U.S. ASA and media funnel assumptions and budget scenarios · Click to enlarge
Three video creatives used in paid promotion, presented alongside the acquisition analysis.